Spotify Wrapped
analyzed music consumption behavior by studying how a Spotify user interacts with songs, artists, and albums over time.
Project Overview
This project analyzes a complete Spotify user's music streaming history to uncover listening behavior patterns, identify top-performing artists, understand track engagement, and evaluate user playback habits over time.
The objective of this analysis was to transform raw streaming data into actionable behavioral insights by understanding music consumption trends, track preferences, skip behavior, and overall listening patterns.
Dataset Overview
The dataset contains detailed Spotify streaming history including user playback activity and behavioral interaction data.
- Playback Timestamps
- Track Names
- Artist Names
- Album Names
- Platform Used
- Playback Duration
- Playback Start Reasons
- Playback End Reasons
- Shuffle Mode
- Track Skip Behavior
Data Cleaning & Transformation
Before analysis, several data preparation steps were performed to ensure consistency and improve analytical accuracy.
- Corrected data types for Track Name, Artist Name, and Album Name columns.
- Converted playback duration from milliseconds into seconds and minutes for time-based analysis.
- Split timestamp column into separate Date and Time columns to improve temporal analysis.
- Verified and standardized data types across all fields.
- Prepared dataset for dashboard visualization and trend analysis.
Key Metrics Tracked
- Total Streams
- Total Listening Time
- Number of Unique Artists
- Number of Unique Albums
- Track Skip Rate
- Average Playback Duration
Analysis Objectives
- Identify the user’s most listened-to artists.
- Determine the most streamed albums and tracks.
- Analyze skip behavior to understand disengagement patterns.
- Identify listening preferences and behavioral patterns.
- Understand long-term music consumption habits.
Key Insights
Top Artists
- The Beatles ranked as the most streamed artist by total tracks played.
- Other highly streamed artists included The Killers and John Mayer.
Top Albums
- The Beatles albums dominated the top streaming rankings.
- Past Masters emerged as one of the most played albums.
Top Tracks
- Most streamed songs included Ode To The Mets and In The Blood.
- These tracks showed consistently high replay frequency.
Track Skip Behavior
- Tracks such as Paraiso and Photograph had the highest skip frequency.
- High skip behavior suggests lower engagement or weaker listener preference.
Behavioral Analysis Findings
- The listener demonstrates strong preference toward classic and alternative music genres.
- Music consumption patterns show repeated engagement with nostalgic and timeless artists.
- High replay frequency suggests emotional attachment to selected artists and albums.
- Skipped tracks highlight differences in user engagement across listening sessions.
Business Value of Analysis
Streaming platforms such as Spotify can use this type of behavioral analysis to improve recommendation systems, understand content engagement patterns, reduce skip rates, and personalize user experiences more effectively.
Understanding listening behavior allows music platforms to optimize content delivery and improve user retention strategies.
Tools Used
- Microsoft Excel — Initial data cleaning and preparation.
- Power BI — Data transformation, analysis, and dashboard development.
- Figma — Dashboard background and UI design.
Conclusion
This project revealed clear music consumption patterns, showing the user’s strong connection to classic artists and repeat listening behavior. The analysis demonstrates how streaming data can be transformed into meaningful behavioral insights that help understand user engagement and support better recommendation systems.
Dashboard Preview
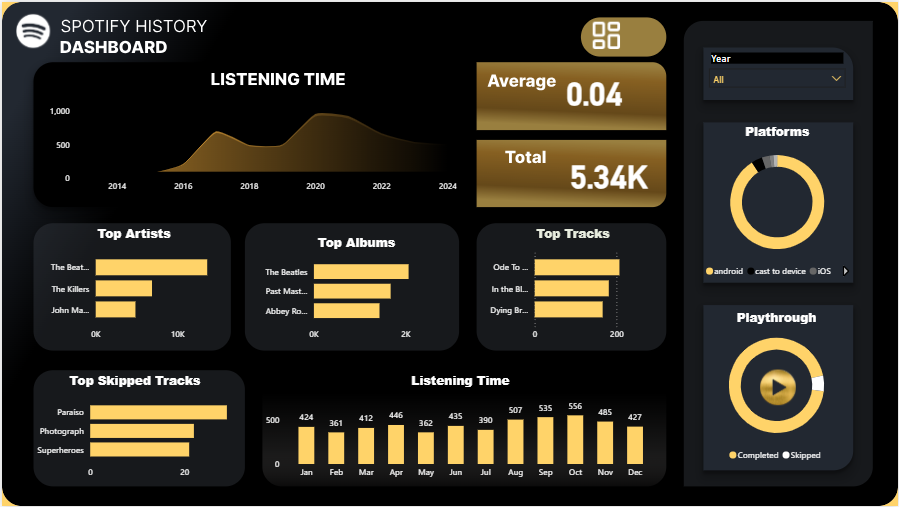 View Interactive Power BI Dashboard